Generating Charts in VFP
Extend the power of your custom software to track key indicators for your business in real time.
Knowlege is power. Being able to distill key points of data into meaningful formats gives you even more power.
If you've designed your automated systems well, and trained your customer service representatives to always ask how customers heard about you, you'll be able to generate graphs like this one in real time—specifying custom date ranges (and additional criteria, if desired). This will quickly show how well your marketing dollars are working.
Armed with these figures, you'll be in a much better position to change how you allocate your expenses. You'll be basing your decisions on facts, rather than hunches.
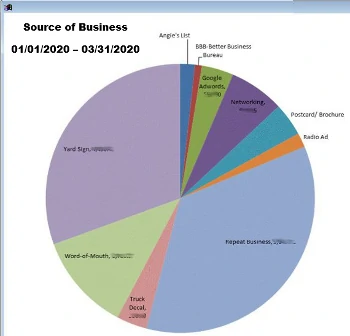
That's the goal of this particular custom software module. It leverages the powerful charting capabilities embedded in Microsoft Excel to display source of business figures in a format that's easy to comprehend. This particular software application fetches raw data from a SQL Server database, digests it into concise rows and columns, then uses Excel Automation to render charts like the one you see here.
This custom software program lets you quickly compare marketing efforts for different timeframes, so you can see what effect your decisions have had over time.
If you'd prefer to look at sales from a different perspective, here's what a bar chart that compared multiple sets of data might look like.
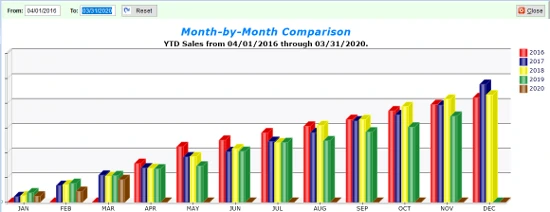
(The example above uses a robust charting engine called FoxCharts.) Contact us to discuss how we could build a custom software solution--leveraging the data you already have--to find out.